2026-11-06 · 10 min read · James Pichardo
Leer en español →Seen Is Not Stopped: 30 Days of Attack Simulations Against Four EDRs
We ran six threat-intel attack chains for a month on endpoints protected by four different EDRs. Almost every attack was seen. Far fewer were stopped, and none of the reasons showed up on a dashboard.
TL;DR
- For 30 days, Project Achilles ran six multi-stage attack chains, built from published threat intelligence, on 27 Windows endpoints of one organization. Each endpoint had one of four EDR products in active mode. We call them EDR A to D.
- Each EDR raised an alert on 81% to 100% of the runs on its hosts. The share of attacks it actually stopped ranged from 30% to 90%.
- The EDR that stopped the most did it mainly by blocking test binaries before they ran. That is real protection, but it also means we never saw how it handles the later stages of an attack.
- One EDR, with every agent reporting "protect" mode, stopped 9% of the attack stages that ran. It raised alerts on many more.
- Three techniques got past every EDR that faced them: masquerading (T1036), exfiltration over the command-and-control channel (T1041) and credential theft from password stores (T1555).
- Five differences between EDRs looked statistically solid until we dropped a single test. Then they nearly vanished. One snapshot is not a measurement.
Why We Ran This
In Your Defenses Look Green. Are They Working? we described how continuous validation works, using illustrative data. This post shows what it found on a real fleet over a month.
We had an unusual setup to work with. The organization runs four different EDR products, each one active on a different group of Windows endpoints. On 13 of the 27 endpoints, a second EDR product also runs in passive mode. Over 30 days, Project Achilles ran the same six attack chains across all of them:
| Attack chain | What it does |
|---|---|
| Kothamine Tailcat | Encrypted command-and-control channel and data exfiltration |
| LockBit 3.0 | Double-extortion ransomware kill chain |
| Qilin (Agenda) | Vulnerable-driver (BYOVD) EDR killer, then injection into svchost |
| Lumma-style infostealer | Browser credential theft through process injection |
| The Gentlemen | GPO-driven, living-off-the-land intrusion |
| Star Blizzard | RedFlick/CosmicPulse espionage chain |
That gave us 177 runs we could analyze, each one split into its stages, plus every alert the four EDRs raised on those hosts during the period.
We don't name the products. Several EDR licenses restrict publishing comparative results. More importantly, most of what we found comes down to configuration and test design, not brand. Treat the letters as four real deployments, not as a product ranking.
1. Almost Everything Was Seen. Far Less Was Stopped.
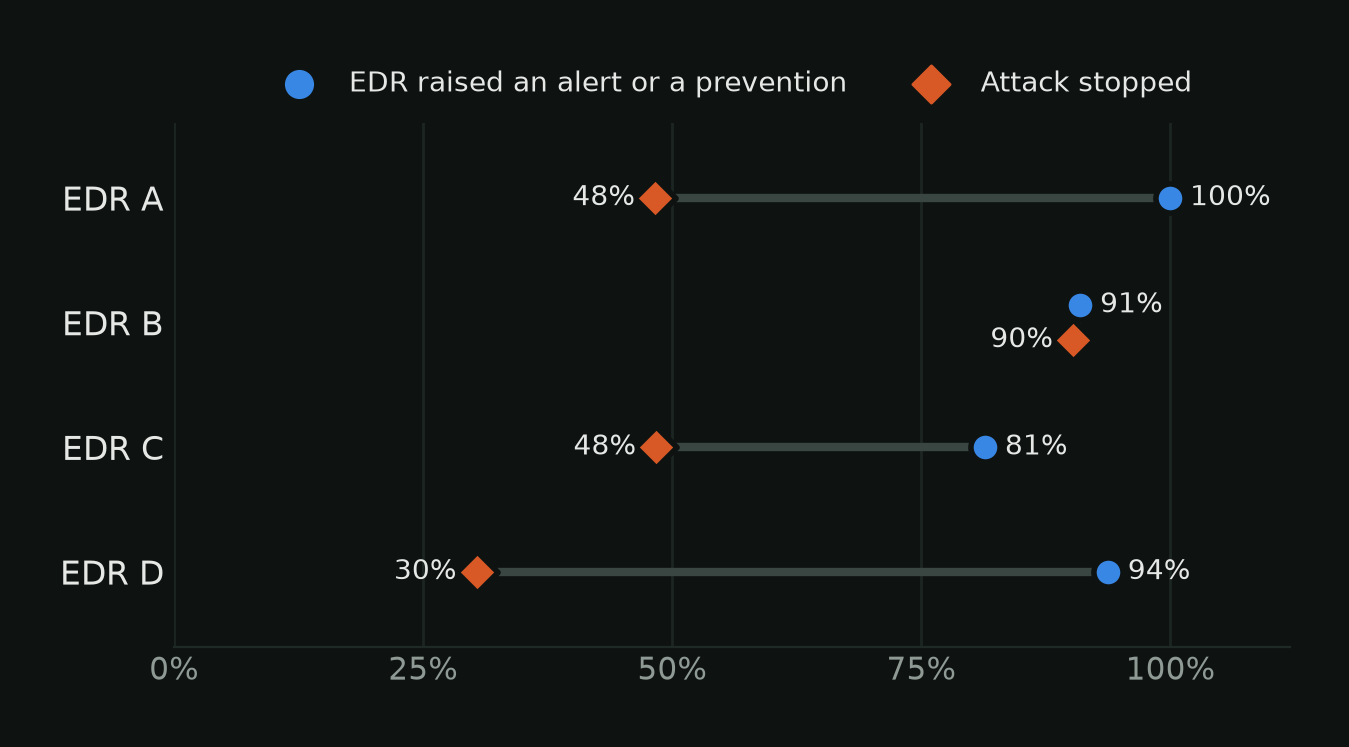
Every EDR raised something on most runs: between 81% and 100% of them. Measured by visibility, they all look good. But in three of the four, there is a gap of 33 to 64 percentage points between "raised an alert" and "stopped the attack".
That gap is not a failure of the dashboard. The dashboard does what it was built to do: it shows that the sensor is running and producing alerts. It does not show whether the attack completed, and an attack whose every stage raises an alert can still reach its objective. A detection only helps if someone acts on it in time.
2. Where an EDR Stops an Attack Decides What You Can Learn
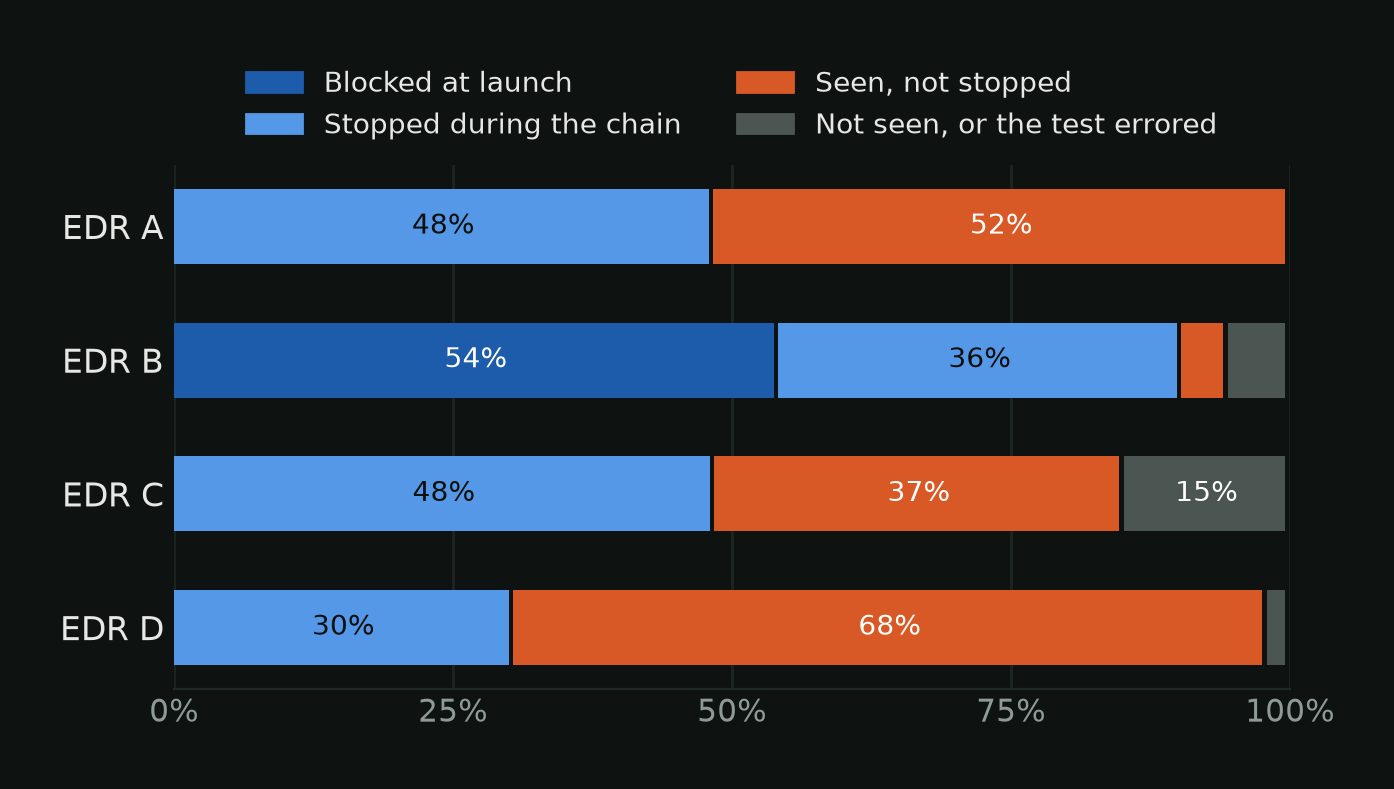
EDR B stopped 90% of attacks, by far the most. More than half of those stops came from blocking the test binary at launch, before any technique ran. That is genuine protection: attackers use fresh binaries too, and refusing to run them is a strong defense.
It also has a side effect. On three of the six attack chains, EDR B's hosts produced no usable stage result at all. So we know EDR B blocks those binaries. We don't know how it would handle the in-memory and living-off-the-land stages if a binary did run, for example one delivered in a way its launch checks don't cover. On the three chains where stages did run, EDR B stopped or detected 54% of them.
The way to fill that gap is a test variant the EDR doesn't stop at launch, such as a chain started from a script or a built-in Windows tool, with the production policy left exactly as it is. Never weaken a protection to make it measurable.
3. "Protect Mode" Is Not a Guarantee
Every EDR D agent reported that it was in protect mode. EDR D still stopped only 30% of attacks and 9% of the attack stages that ran. In 68% of its runs, it raised alerts and let the chain continue.
A likely cause: modern EDRs have several detection engines (behavioral rules, custom rules, cloud analytics), and each engine has its own response setting. The agent can be in protect mode while the engines that actually fired are set to alert only. Check this engine by engine, not agent by agent.
EDR A shows a different pattern. It detected every run and stopped 48%, but all-or-nothing by attack chain. It stopped every Kothamine run and none of the Lumma, Gentlemen or Star Blizzard runs, while raising alerts on all of them. Its policy blocks some kinds of behavior and only reports others.
4. Alert Time Is Not Block Time
Median time from the start of a run to the EDR's first alert:
| EDR | Median time to first alert | Runs with an alert |
|---|---|---|
| EDR A | 24 s | 30 |
| EDR B | 64 s | 41 |
| EDR D | 73 s | 34 |
| EDR C | 2.3 min | 46 |
These numbers measure how fast the alert reaches the console, not how fast the attack was blocked. EDR B blocks binaries at launch, within the first second, yet its alerts for those blocks appeared about a minute later. For your SOC, alert time is what matters: it's how long before anyone can respond. For the attack, block time is what matters. Measure them separately, and be suspicious of any vendor figure that doesn't say which one it is.
One more thing worth measuring: the ATT&CK technique on the alert matched the technique the test actually performed in only 14% to 49% of alerts, depending on the EDR. If your SOC triages or reports by ATT&CK technique, it's working from labels that are often wrong.
5. A Second Sensor Helps Some Groups and Not Others
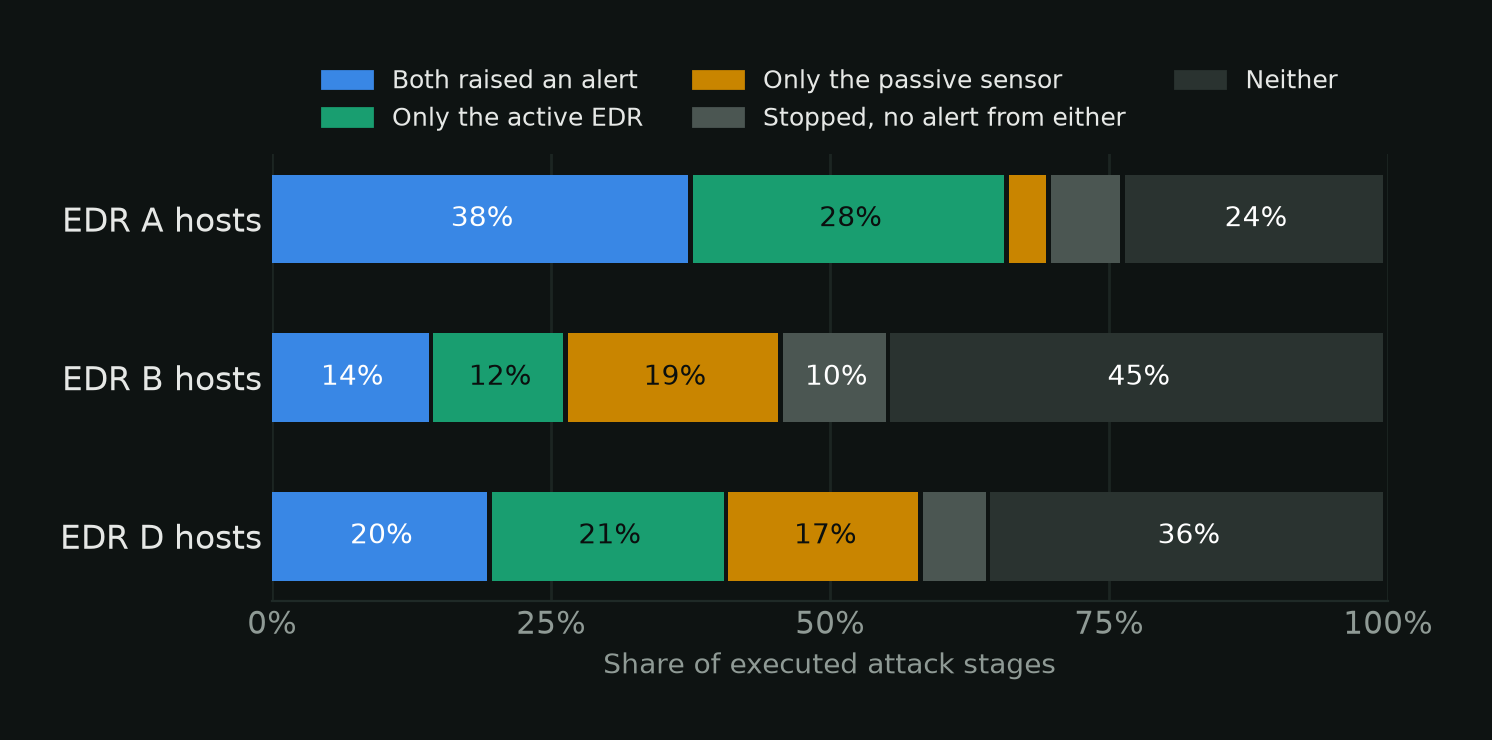
On 13 hosts, a second EDR product ran in passive mode next to the active one, so both watched exactly the same attacks. How much the second sensor added depended entirely on its partner:
- On EDR B hosts, the passive sensor raised alerts on 16 stages that EDR B did not, against 10 the other way round.
- On EDR D hosts, it was nearly even: 23 against 28.
- On EDR A hosts, it added almost nothing: 4 against 30.
Some of those stages may have been stopped by the active EDR without an alert, so this measures visibility, not protection. It still answers a common licensing question with data instead of opinion: a second sensor is worth what it adds on your hosts, next to your primary EDR, and that can be measured.
6. Three Techniques Nobody Caught
Three techniques were missed in at least 80% of their stages by every EDR that faced them:
- T1036, Masquerading: binaries disguised as legitimate programs.
- T1041, Exfiltration over the C2 channel: stolen data leaving through the attacker's own connection.
- T1555, Credentials from password stores: harvesting saved credentials.
These aren't reasons to pick one EDR over another, because none of them caught these. They are a detection-engineering backlog: custom rules, network monitoring for data leaving through C2, and hardening of credential stores. You only find a backlog like this by running the techniques.
How Sure Can We Be?
With 4 to 14 hosts per EDR, it's easy to see a pattern that isn't there. We treated the host, not the run, as the unit of analysis, and gave every comparison a confidence label based on a bootstrap over hosts. A difference is labelled clear only if all of these hold:
- the 95% interval excludes zero,
- each EDR has at least three hosts,
- the difference holds when any single host is left out,
- the difference holds when any single attack chain is left out,
- the comparison rests on at least three attack chains both EDRs faced.
What held up. EDR B stopped 42 to 60 percentage points more attacks than each of the other three. That difference is clear and survives removing any host or any test. EDR A and EDR C stopped the same share of attacks (48% each), so there's no winner there.
What didn't. Five differences passed every check except the last one:
| Difference | Gap | Without that test |
|---|---|---|
| EDR C stops more attacks than EDR D | +18 pp | +6 pp without Lumma |
| EDR A stops more attacks than EDR D | +18 pp | +2 pp without Kothamine |
| EDR A stops more stages than EDR D | +22 pp | +3 pp without Kothamine |
| EDR C sees more stages than EDR B | +14 pp | +1 pp without LockBit |
| EDR A sees more stages than EDR C | +12 pp | +2 pp without Kothamine |
Each one is real, but it's about one attack chain, not the EDR in general. "EDR A sees more than EDR C" really means "EDR A handled Kothamine much better", which is more specific and more useful to act on.
Three more effects make single measurements unreliable:
- The same test on the same host doesn't always give the same result. Across repeated runs, the outcome was identical only 50% to 75% of the time, depending on the EDR. One run tells you little.
- Test binaries change. The attack chains were rebuilt during the month, and not every EDR saw every build. Recomputing on only the build every EDR saw (five of the six chains) gives stop rates of 58% for A, 90% for B, 57% for C and 38% for D. EDR B still leads, but by less.
- Integrations start at different times. One EDR's alert data only covered the last eight days of the period, so its earlier runs were left out instead of being counted as misses.
What This Means for Your Environment
None of these findings appear in an EDR console, and most wouldn't appear in an annual penetration test either: one run, on one build, on a handful of hosts, can't distinguish "this EDR is better" from "this EDR did better on this test". That's the case for continuous validation in practice:
- Measure stopped separately from seen. An alert on every stage of an attack that completed is not protection.
- Check response settings per detection engine, not per agent.
- Measure alert latency separately from block time.
- Run the techniques nobody blocks, and turn the misses into detection rules.
- Repeat across hosts and over time before deciding anything, and keep a confidence label next to every comparison.
- If you pay for a second sensor, measure what it adds on each group of hosts.
Every number in this post came from data Project Achilles already collects: test runs, per-stage results and the EDR alerts it correlates with them. To measure your own environment, Install Project Achilles in 30 Minutes walks you through it from scratch, and the interactive explainer shows the loop in motion.